To view tables and graphs referred to in the errata, please log in.
| p. 9 | Figure 1.2, two boxes contains typos (should be Exploration, Dimension, and methods) |
| p. 20 | Please ignore the second word in Chapter 2 ("Kare"). |
| p. 29 | Should be: "If MEDV < $30,000, CAT.MEDV=0." |
| p. 49 | Caption of Figure 3.2: third sentence should start with "A categorical outcome variable, if it is plotted, will appear on the categorical axis" |
| p. 78 | Example 2: text should read "77 cereals". Note: Using Excel's Data Analysis will yield slightly different numbers for the covariance matrix, due to using n instead of n-1 in the denominator. This difference is not important. |
| p. 114 | Line 2: replace 21.4% with 23.24%. |
| p. 129 | Cp formula and following text: replace SSR with SSE ("SSE is the sum of squared errors in the ANOVA table"). |
| p. 136 | Item (vi) should read: "Predict the reduction in average fare on the route in (v) if Southwest decides to serve this route [using model (iii)]." |
| p. 146 | Problem 7.1, part (d): add at the beginning "Consider the following customer: Age=40, Experience=10, Income=84, Family=2, CCAvg=2, Education_2=1, Education_3=0, Mortgage=0, Securities Account=0, CD Account=0, Online=1 and Credit card = 1." |
| p. 177 |
Fig 9.11 shows that Education was used as well as its dummy variables as inputs. This is incorrect: one should include either Education (with numerical codes 1,2,3...) or the dummies as inputs. |
| p.182-3 | Due to a change in XLMiner implementation, Figures 9.14 and 9.15 have slightly changed. Here are the updated figures. 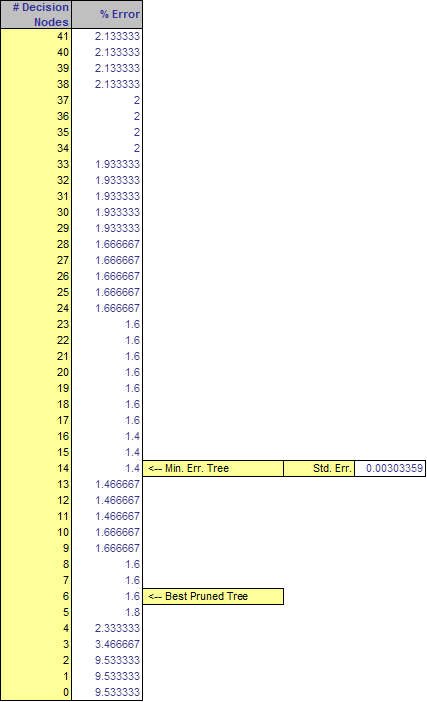 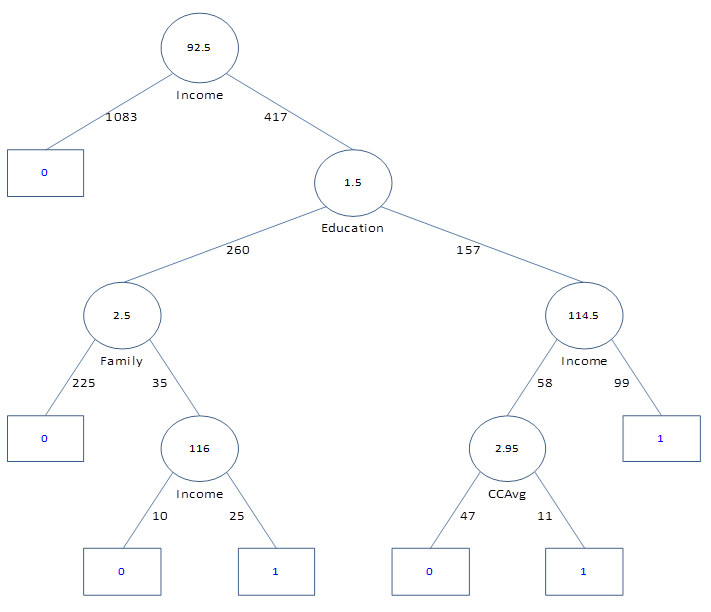 |
| p. 184 |
The top of Fig 9.16 should read "Training Data Scoring - Summary Report (Using Best Pruned Tree)" |
| p. 195 | The term "log" refers to the natural logarithm (ln). |
| p. 201 | Bottom of page: "In other words, β1 is the multiplicative factor". Replace β1 with exp(β1). |
| p. 206 | The percent of delayed flights among these 2201 flights is 19.5%. |
| p. 207 | Table 10.3 is not based on the correct dataset. The corrected table is: 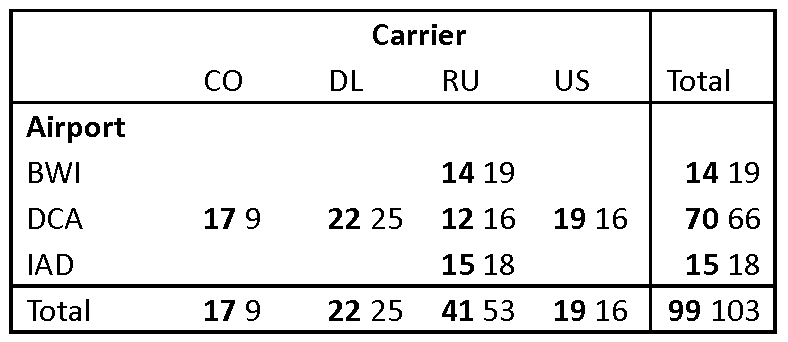 . .However, this table can be completely ignored without losing necessary information. |
| p. 211 | Lines 5-7: ignore the sentence "This means that there are multiple combinations... any flight" |
| p. 223 | Table 11.2: For the actual data used in the illustration, PROFIL_I_R was recoded as "road level" or "other," and SUR_COND has only 4 of the 7 possible values -- dry, wet, snow, and ice. These, ordered as 1, 2, 3, 4, fairly well reflect their degree of hazard and were left as an ordered categorical variable without creating dummies. |
| p. 230 | Figure 11.4, bottom most table, the six 1 values in the "Predicted Class" column should be zeros. The rest of the output is correct (the error is due to an earlier output bug in XLMiner that has been fixed). |
| p. 246 | Last term in equation (12.1) under the square root should be (xp - x̄p)2 |
| p. 247 | Mahalanobis distance is defined as the square root of the formula in equation (12.2). This does not affect any of the derivations or calculations in the chapter (in fact, the sqrt is typically dropped in practice to save computing time). |
| p. 252 | Section 12.5 last sentence: replace "exceeds" with "is below". |
| p. 253-4 | Section 12.7 second paragraph: switch "no-injury" with "nonfatal". |
| p. 259 | Question 12.2(c): "four years of higher education" should be "four months of experience". |
| p. 277 | Question 13.3, the first sentence should read "The data shown in Figure 13.7 and the output in Figure 13.8 are from a subset of a dataset on cosmetic purchases (Cosmetics-small.xls) given in binary matrix form." |
| p. 289 | The centroid distance calculation should be (-0.020 – 0.296)2 |
| p.292 | In the list of clusters based on Figure 14.3, cluster #1 should be {1,2,4,10,13,20,7,12,21,15,14,19,18,22,9,6} and cluster #3 should be {3}=Central. |
| p.293 | In the list of clusters based on Figure 14.4, cluster #1 should be {1,14,19,18,3,6,9} and cluster #4 should be {7,12,15,21}. |
| p. 319 | The residual plot in Figure 16.3 is incorrect. The correct figure is shown below: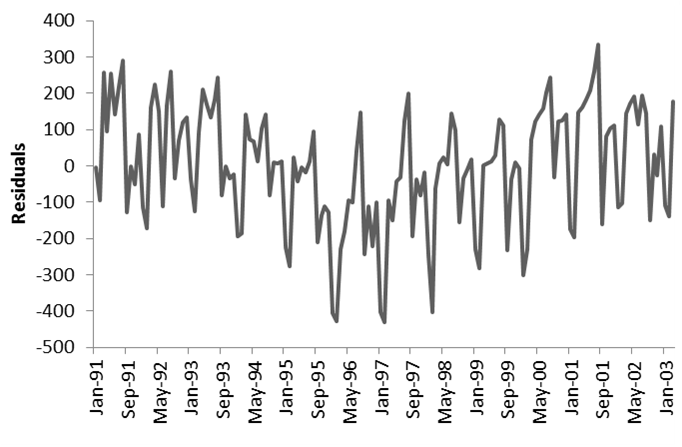 |
| p. 320 | The term "log" used throughout the chapter refers to the natural logarithm (ln). |
| p. 321 | Two right columns of Figure 16.5 are incorrect. The correct Figure is: 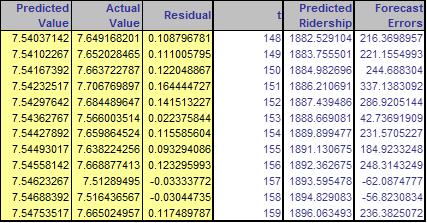 |
| p. 335 | Problem 16.1 part (d) - XLMiner now creates dummies for each category. The comment in parentheses should read: "(XLMiner will create 12 dummies; use only 11 and drop the April dummy)". |
| p. 332 | last sentence of the second to last paragraph should read "If the hypothesis is rejected ..." |
| p. 335 | Problem 16.1 part (f) should read: "Fit linear regression models to Air, Rail and to Auto with additive seasonality and an appropriate trend. For Air and Rail, fit a linear trend. For Rail, use a quadratic trend. Remember to use only pre-event data. Once the models are estimated, use them to forecast each of the three post-event series." |
| p. 340 | Problem 16.6 part (b)(i) should read "which month tends to have the highest average sales during the year?". |
| p. 342 | Problem 16.6 part (e) should read "Continuing with model B [with log(Sales) as output], create an ACF plot until lag 15 for the forecast errors. Now fit an AR model with lag 2 [ARIMA(2,0,0)] to the forecast errors." |
| p. 358 | Problem 17.6 part (b) should open with: "The forecaster was tasked to generate forecasts for 4 quarters ahead. He therefore partitioned the data such that the last 4 quarters were designated as the validation period. The forecaster approached the forecasting task by using multiplicative Holt–Winter’s exponential smoothing..." |
| p. 387 | Data section: The descriptions for the 22 variables... |
| END ERRATA |